Monitoring Chrony with Grafana and Telegraf
How to setup Telegraf, InfluxDB and Grafana to provide remote Chrony time server monitoring


In my previous post I created some new NTP servers for my lab to replace the older CentOS 8 servers that I had - one of which recently failed without me noticing!
Having got the new servers up and running using Photon OS and Chrony, it's now time to focus on keeping an eye on what's going on.
Of course, I have vRealize Operations in my lab and it's very capable of being used for this purpose. However, from time to time I remove it and re-deploy it. So I also have Grafana deployed and use it for things that don't change too much.
This post isn't about setting Grafana up in the first place, there are other great blogs around that cover that. For example, Jorge de la Cruz and Rudi Martinsen both have great content. Instead, this is about getting Telegraf installed and setup on my NTP servers to sent data to InfluxDB so that Grafana can query and display it. Time for a diagram...
How it works
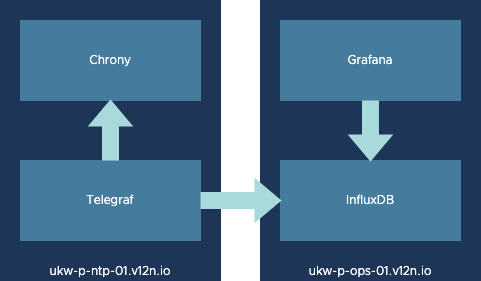
There are two servers involved here. On the left, one of my NTP servers. We have already installed Chrony, but now we need to add and configure the Telegraf agent. We're going to configure it to use the chronyc utility to query the chronyd service and return some measurements. Telegraf will also then be configured to forward these measurements to InfluxDB running on the monitoring server on the right. Grafana can then pull the measurements and display / act on them.
Now although I already have Grafana and InfluxDB in place, I do need to make some changes to InfluxDB to permit a remote Telegraf agent to access it. Let's start there.
InfluxDB (on ukw-p-ops-01)
There are three things that we need to do with InfluxDB to get it ready. The first is to open up a firewall port.
InfluxDB has an HTTP input plugin that Telegraf can leverage. By default this uses TCP on 8086, so that need to be opened up.
firewall-cmd --add-port=8086/tcp --permanent
firewall-cmd --reload
Secondly, we ought to create some users in InfluxDB so that we can enable authentication rather than just having everyone able to send measurements to the database. This is achieved by running the influx command line utility. We can then create users...
CREATE USER "influxadmin" WITH PASSWORD 'Ch4ngeMe!' WITH ALL PRIVILEGES
CREATE USER "influxread" WITH PASSWORD 'Ch4ngeMe!'
CREATE USER "influxwrite" WITH PASSWORD 'Ch4ngeMe!'
and grant them appropriate access to the database (which is called 'telegraf' in this instance).
GRANT READ ON "telegraf" TO "influxread"
GRANT WRITE ON "telegraf" TO "influxwrite"
Finally we need to enable the HTTP input plugin and authentication. This involves editing the /etc/influxdb/influxdb.conf file.
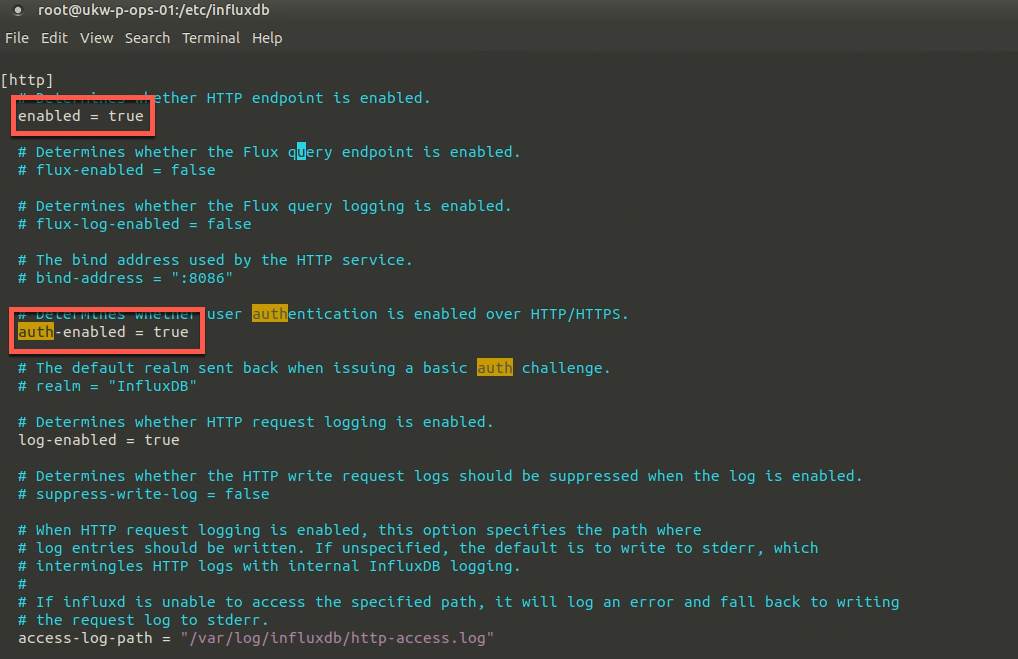
The two lines that have to be changed are under the [http] section. Uncomment both lines and set them as follows:
enabled = true
auth-enabled = true
(Optionally you can enable the access logs if you want.) To implement the change, just restart InfluxDB:
systemctl restart influxdbTelegraf (on ukw-p-ntp-01)
Moving on to the time server we want to monitor, we will need to install and configure Telegraf.
The installation is easy (remember this host is running Photon OS, hence the use of tdnf):
tdnf install telegraf -y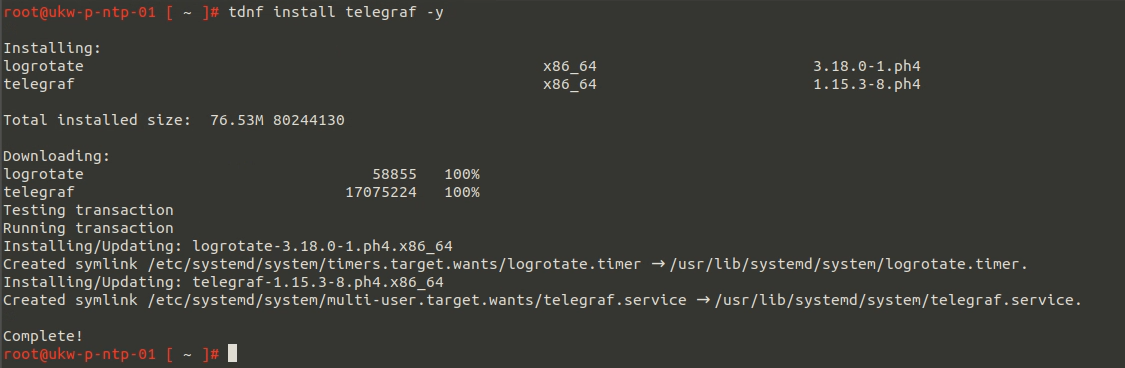
Told you it was easy!
Inputs
Next we need to make some configuration changes to Telegraf. By default it will pull in configurations from a subfolder (if present) which makes it handy to keep things tidy. So first we will create that and change the owner to the 'telegraf' user.
mkdir -p /etc/telegraf/telegraf.d
chown telegraf:telegraf /etc/telegraf/telegraf.d
Next we're going to instruct Telegraf to take inputs from Chrony, which it will do using the chronyc utility. Luckily Telegraf includes a plugin for Chrony, we just have to enable it. To do that we create a file called /etc/telegraf/telegraf.d/chrony.conf and add the following content:
# Get standard chrony metrics, requires chronyc executable.
[[inputs.chrony]]
  ## If true, chronyc tries to perform a DNS lookup for the time server.
  # dns_lookup = false
I also would like to get some basic system stats across. For example, uptime and CPU utilisation. For that we can enable the system plugin by creating another file called /etc/telegraf/telegraf.d/system.conf with the following content.
# Read metrics about system load & uptime
[[inputs.system]]
  # no configuration
Make sure that both files are owned by the 'telegraf' user and have permissions set at 640.
Outputs
Now that Telegraf is ready to collect measurements, we need to tell it where to send them. For this we need to configure an output plugin for InfluxDB.
Once more we can create a file called /etc/telegraf/telegraf.d/outputs.conf for this with the following example content:
[[outputs.influxdb]]
  urls = ["http://ukw-p-ops-01.v12n.io:8086"]
  insecure_skip_verify = true
  database = "telegraf"
  skip_database_creation = true
  precision = "s"
  timeout = "5s"
  username = "influxwrite"
  password = "Ch4ngeMe!"
  retention_policy = ""
Obviously this needs to be customised to suit the environment and again must be owned by the 'telegraf' user. We could have combined all of these three files in to one or even have made the changes in the main telegraf.conf file but I think that this separation is better to understand.
Start Telegraf
That's all we need to do now except enable the service and start it.
systemctl enable telegraf
systemctl start telegraf
All being well then we should see some measurements hit InfluxDB. Which we can verify easily enough before moving on to Grafana.
Verify Measurements (on ukw-p-ops-01)
If you enabled it then you could look at the HTTP access log for InfluxDB, but I think that querying the database would be a better demonstration. This is achieved using the influx command line utility.
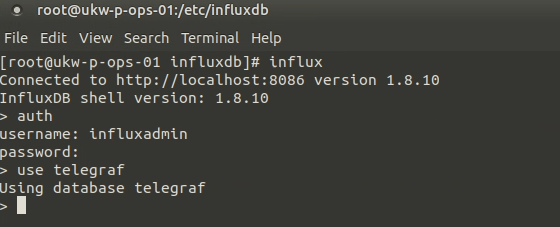
Notice that now we must use the 'auth' command to authenticate to InfluxDB before we can do anything. Once the correct database is selected ('telegraf' in my case), we can check to see if we have any measurements.
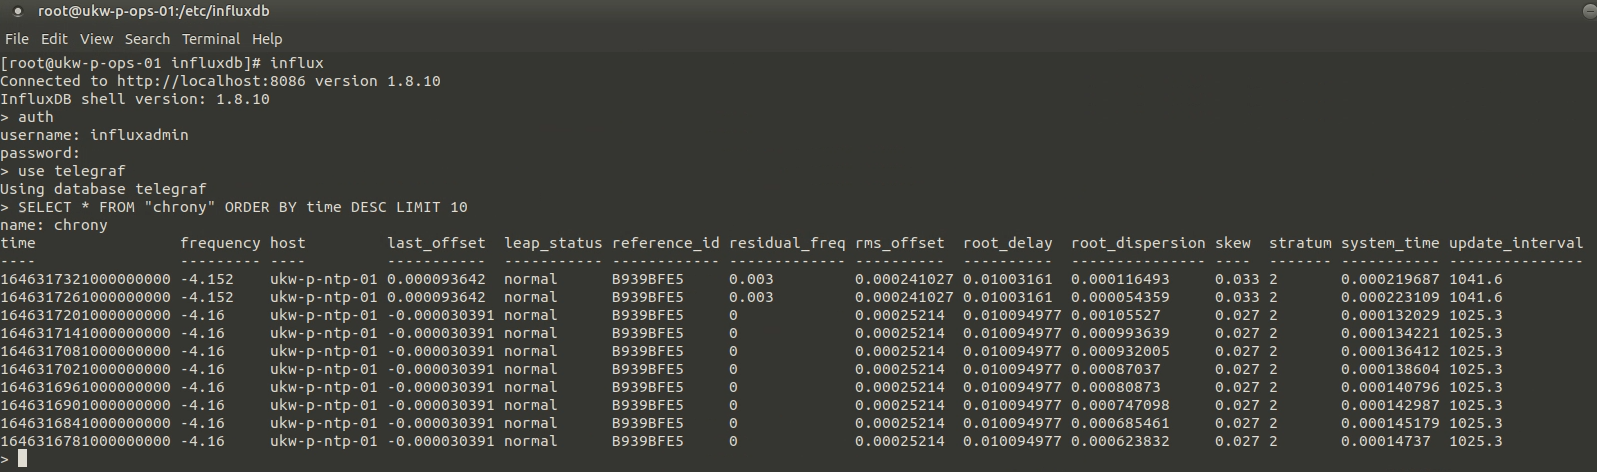
This is good!
Grafana (on ukw-p-ops-01)
It took me a while to get used to how dashboards are constructed in Grafana through the web interface, but I'm getting the hang of it now.
Using the information provided by the Chrony and System plugins in Telegraf, I was able to create 3 simple panels that showed:
- The uptime of the OS on the NTP server
- The system load on the NTP server
- The time skew in the Chrony daemon
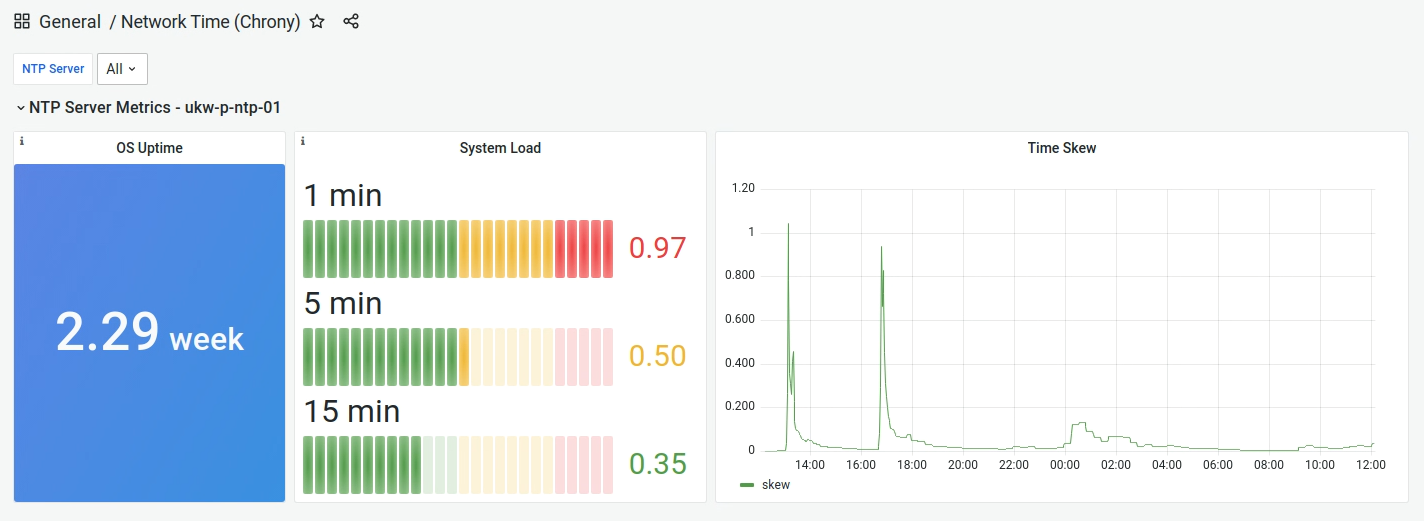
I'll get this dashboard published on the Grafana dashboard page in due course once I've tweaked it a little. What I really like though is that as soon as I configure my second NTP server with Telegraf in the same way, it will automatically show up on the dashboard!